BDI: 1,842 ▼ 1.2%
COTTON NO.2: 84.12 ▲ 0.4%
LME COPPER: 8,432.50 ▲ 2.1%
FOOD SAFETY INDEX: 94.2 ARCHIVE_SECURED
OPTICAL INDEX: 11,204.09 STABLE
BDI: 1,842 ▼ 1.2%

SECTOR INDEX
V.24.08 ARCHIVE
Hot Articles
- When Is a Straddle Monorail System a Good Fit for Urban Transit Corridors?Is a straddle monorail system right for your urban corridor? Explore capacity, space, station access, safety, and lifecycle costs to make a confident transit investment.
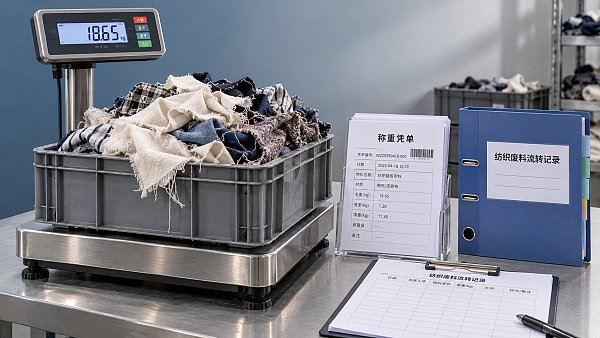
- EU Textile Waste Reporting: Who Must Report and What Data Is Required?EU textile waste reporting explained: discover who must report, what data is required, and how to verify EPR, waste records, and shipment compliance across EU markets.
- Yarn Strength Benchmarks for Weaving: Setting Warp and Weft RequirementsSet yarn strength benchmarks for weaving with practical warp and weft criteria. Learn how tenacity, variability, and loom loads inform specifications that help reduce breaks and improve reliability.
How reliable is food processing water usage data?


For quality control and safety managers, food processing water usage data is more than an operational metric—it influences hygiene validation, regulatory compliance, cost control, and risk prevention. Yet many facilities still rely on fragmented meters, manual logs, or inconsistent reporting standards, making reliability difficult to verify. This article examines why water usage data can vary across processing lines, sanitation cycles, and reporting systems, and how organizations can assess data integrity before using it for audits, benchmarking, or sustainability decisions.
Why food processing water usage data becomes unreliable in real facilities
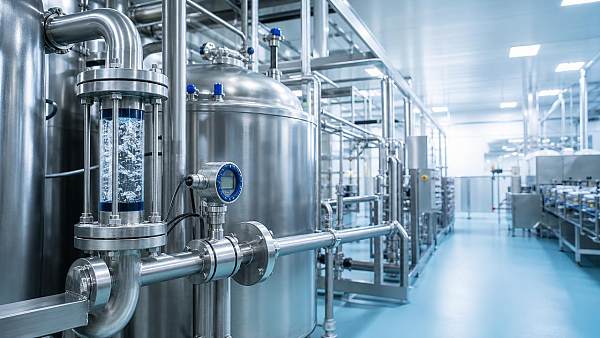
Food processing water usage data often looks precise because it is expressed in liters, gallons, cubic meters, or cost per production unit. In practice, the number may combine product contact water, boiler feed, cooling, cleaning, employee hygiene, and wastewater dilution.
For a safety manager, the risk is not only financial. If the facility cannot separate sanitation water from production water, a hygiene deviation may be hidden inside an apparently normal daily total.
Reliability also depends on where data is captured. A main inlet meter may support utility billing, but it rarely proves whether a specific washer, blancher, CIP skid, or packaging room used water according to procedure.
Common sources of distortion
- Meters are installed at plant level, while audit questions are asked at process, line, or cleaning program level.
- Manual logs are completed after production, causing rounding, transcription errors, or missing start and stop times.
- Sanitation cycles are changed by operators during allergen changeovers, but the reporting template remains unchanged.
- Temporary hoses, bypass valves, and rework activities consume water outside the main digital monitoring points.
- Wastewater discharge, incoming water, and recirculated water are reported together without a clear data dictionary.
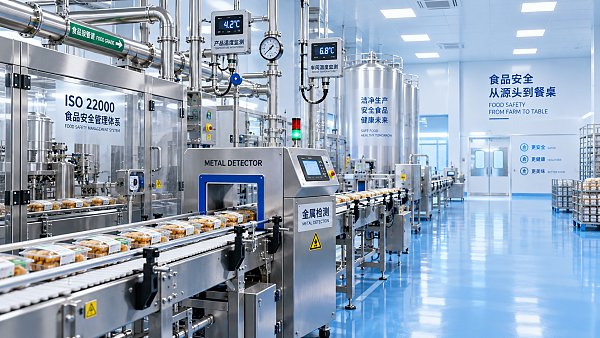
This is why food processing water usage data should be treated as a controlled quality record, not just a facilities management statistic. The same discipline used for temperature, pressure, metal detection, and microbiological testing should apply.
What should quality and safety teams verify before trusting the numbers?
Before food processing water usage data is used in an audit, sustainability report, sanitation validation, or procurement benchmark, teams should test whether the data is complete, traceable, comparable, and relevant to risk.
The following table gives a practical screening method for facilities that operate mixed product categories, tight delivery schedules, or multiple cleaning procedures.
A reliable dataset does not need to be complex, but it must be explainable. If the team cannot state what the number includes, the food processing water usage data should not be used as primary evidence.
How different processing scenarios change water data interpretation
Water demand varies widely across meat, dairy, beverage, bakery, frozen food, fresh-cut produce, and ready-to-eat processing. Comparing facilities without process context can create false conclusions.
For example, a plant with frequent allergen changeovers may use more sanitation water than a high-volume single-product line, even if both have strong control programs.
Scenario-based interpretation checklist
- Compare water use against production volume, but also against product risk class, soil load, and sanitation frequency.
- Separate routine production water from non-routine events, such as product recall cleaning, equipment trials, or commissioning.
- Review whether water reuse, recirculation, filtration, or heat recovery changes the meaning of gross and net consumption.
- Check whether shift patterns, labor availability, and downtime cause extended hose use or repeated cleaning steps.
The next table shows how the same food processing water usage data may require different interpretation depending on facility type and risk profile.
This scenario approach prevents one of the most common mistakes: treating a low water number as automatically efficient. In food safety, unusually low usage can also indicate skipped rinsing, blocked nozzles, or incomplete cleaning.
Which systems make food processing water usage data more audit-ready?
Audit-ready food processing water usage data requires more than sensors. It needs a governance model that connects measurement devices, production context, change control, and documented verification.
Data sources to compare before investment
- Utility bills are useful for total cost control, but they are too delayed for sanitation deviation investigation.
- Mechanical flow meters provide localized readings, but accuracy depends on installation, maintenance, and operator discipline.
- Digital meters connected to SCADA or MES platforms improve traceability when timestamps and production events are aligned.
- Manual verification remains important for abnormal events, temporary connections, and cross-checks during internal audits.
Procurement teams should avoid buying instrumentation only because it produces dashboards. For quality and safety managers, the essential question is whether the system can defend decisions during customer audits, regulatory reviews, or corrective action investigations.
Practical system requirements
- The platform should allow tagging by line, batch, product family, cleaning recipe, and shift.
- The meter specification should match flow range, water temperature, chemical exposure, pressure, and pipe material.
- The reporting workflow should include exception review, approval responsibility, and evidence retention.
- Data export should support benchmarking without exposing confidential recipe or customer information.
G-MCE approaches this challenge through cross-disciplinary benchmarking. Lessons from smart grid telemetry, maritime instrumentation, and industrial automation can improve how water measurement is specified and validated in food processing environments.
Standards, compliance, and documentation: what evidence is credible?
Food processing water usage data may support programs linked to HACCP, GMP, ISO 22000, FSSC 22000, BRCGS, environmental management, or customer sustainability scorecards. Each program asks a different question.
Food safety systems focus on whether water use supports hygienic conditions. Environmental systems focus on reduction, discharge, and resource efficiency. Procurement teams focus on cost, hardware reliability, and implementation risk.
Documentation that strengthens credibility
- A controlled data dictionary defining potable water, process water, reused water, sanitation water, and wastewater.
- Meter calibration and verification records aligned with the facility’s maintenance and quality procedures.
- Change control records when a line is modified, a new CIP recipe is introduced, or a water-saving device is installed.
- Corrective action records showing how abnormal water trends were investigated and closed.
- Periodic management review connecting water trends with sanitation performance, complaints, environmental results, and cost.
A strong evidence package does not claim that every reading is perfect. It shows that uncertainty is understood, monitored, and controlled. That distinction is important when food processing water usage data is challenged by auditors or customers.
Procurement criteria for meters, software, and benchmarking support
When budgets are limited, teams often ask whether they should invest first in meters, software, consulting, or staff training. The answer depends on the weakest link in the current data chain.
Use the following procurement-oriented comparison to prioritize improvements without overbuilding the system.
The right purchase is rarely the most expensive device. It is the option that reduces uncertainty in the highest-risk decision: hygiene validation, regulatory defense, cost reduction, or supplier selection.
How to implement a reliable water data review program
A practical implementation program should start with risk ranking, not equipment shopping. Quality and safety teams need to know where poor food processing water usage data could affect food safety, compliance, or customer commitments.
Step-by-step implementation path
- Define data boundaries by line, utility area, cleaning circuit, and discharge point, then document ownership for each record.
- Create a meter map and compare it with actual floor conditions, including hoses, bypasses, and temporary connections.
- Run a short baseline period covering normal production, high-risk changeovers, maintenance downtime, and sanitation shifts.
- Set alert thresholds that reflect process knowledge, not only statistical averages from monthly totals.
- Review exceptions in a cross-functional meeting involving QA, sanitation, engineering, production, and EHS.
- Update procedures, training, and procurement specifications when recurring gaps are found.
This approach turns food processing water usage data into an operational control loop. It also helps avoid conflict between departments because decisions are based on agreed definitions and visible evidence.
FAQ: practical questions about food processing water usage data
Is food processing water usage data from utility bills reliable enough?
Utility bills are reliable for total purchased water and cost reconciliation, but they are usually too broad for food safety decisions. They cannot show whether a specific rinse, washer, or sanitation step performed correctly.
What is the biggest mistake when benchmarking water use between plants?
The biggest mistake is comparing liters per kilogram without adjusting for product category, sanitation frequency, reuse systems, operating hours, and risk class. A plant with more changeovers may legitimately use more water.
Can lower water consumption create food safety risk?
Yes. A sudden reduction may reflect a genuine efficiency improvement, but it can also indicate shortened rinsing, blocked spray nozzles, skipped washdown, or incorrect CIP sequencing. Trend changes require verification.
How often should meters be reviewed or calibrated?
Frequency depends on risk, device type, manufacturer guidance, water quality, and audit requirements. Critical meters linked to sanitation validation should be reviewed more rigorously than meters used only for cost allocation.
Why choose G-MCE for water data benchmarking and decision support?
G-MCE supports organizations that need more than isolated technical opinions. As a cross-disciplinary B2B intelligence hub, we connect industrial food processing technology with benchmarking methods from advanced manufacturing, smart infrastructure, precision sensing, and global procurement analysis.
For quality control and safety managers, this means food processing water usage data can be reviewed through both compliance and operational lenses. We help teams ask whether the data is measurable, defensible, comparable, and useful for decisions.
Consult us when you need to clarify
- Which parameters should be captured for a specific processing line, CIP system, washer, or sanitation zone.
- How to compare meter options, digital reporting tools, and integration requirements before procurement.
- Which documentation supports audits, customer reviews, certification programs, or sustainability reporting.
- How to normalize food processing water usage data for multi-site benchmarking or supplier evaluation.
- What delivery timeline, customization scope, sample support, or quotation structure should be requested from vendors.
If your facility is preparing for an audit, upgrading water monitoring, or comparing equipment proposals, G-MCE can help define the evaluation framework before capital is committed. Reliable food processing water usage data begins with clear boundaries, suitable instruments, disciplined records, and decisions that match real production risk.
Recommended for You
 Digital SeaWhen Is a Straddle Monorail System a Good Fit for Urban Transit Corridors?Is a straddle monorail system right for your urban corridor? Explore capacity, space, station access, safety, and lifecycle costs to make a confident transit investment.By: Captain Kenji SatoOct 19, 2026
 Fabric LogicEU Textile Waste Reporting: Who Must Report and What Data Is Required?EU textile waste reporting explained: discover who must report, what data is required, and how to verify EPR, waste records, and shipment compliance across EU markets.By: Chloe DuboisOct 18, 2026
 Fabric LogicYarn Strength Benchmarks for Weaving: Setting Warp and Weft RequirementsSet yarn strength benchmarks for weaving with practical warp and weft criteria. Learn how tenacity, variability, and loom loads inform specifications that help reduce breaks and improve reliability.By: Chloe DuboisOct 17, 2026
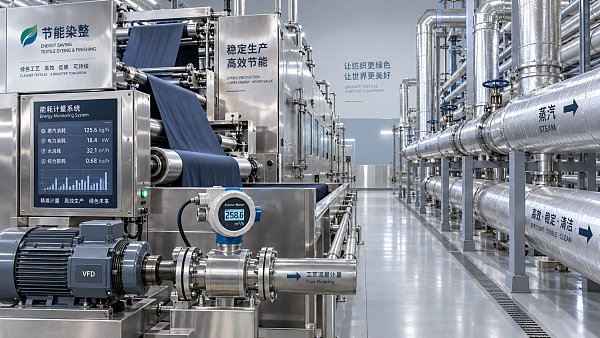
 Fabric LogicEnergy-Saving Textile Machinery: How to Calculate Payback for Your MillEvaluate energy saving textile machinery with a practical payback formula, real-world cost factors, and a worked example. Discover how to verify savings and invest confidently in your mill.By: Chloe DuboisOct 16, 2026
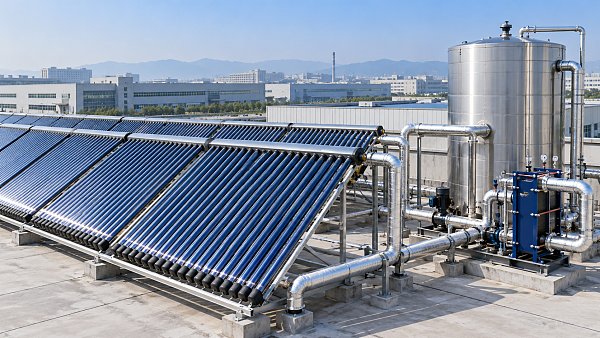
 Digital SeaETSC Adoption in Europe: Policy Drivers, Costs, and Implementation BarriersExplore ETSC adoption Europe-wide: uncover policy drivers, installed costs, and implementation barriers to evaluate solar thermal investments and identify projects with stronger returns.By: Captain Kenji SatoOct 15, 2026
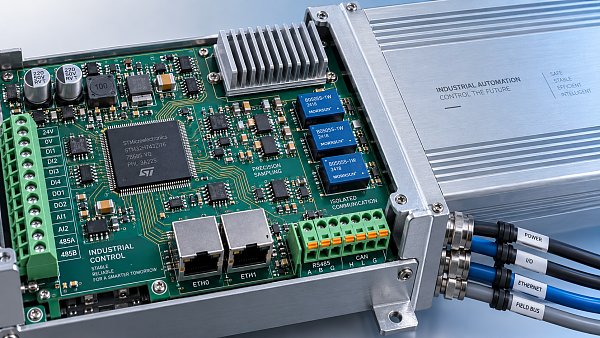
 Digital SeaChoosing Semiconductor Solutions for Industrial Controls: Key Design CriteriaChoose semiconductor solutions for industrial controls with confidence. Explore key criteria for timing, accuracy, power, safety, and lifecycle support to make smarter design decisions.By: Captain Kenji SatoOct 14, 2026
 Aseptic FillingWhen Should Compliance Checks Start for Aseptic Filling Procurement?How early should compliance checks start in procurement planning? Learn why aseptic filling reviews should begin before supplier shortlisting to reduce risks, rework, and costly delays.By: Marcus SterlingOct 13, 2026
 Smart MetersHow Do You Assess Market Demand Before Sourcing New Smart Meters?How do I assess market demand before sourcing a new industrial product? Discover how to validate smart meter demand, check technical fit, and reduce inventory risk before committing to bulk orders.By: Dr. Elena VoltOct 13, 2026
 GIS SwitchgearWhat Should You Compare Besides Price When Selecting GIS Switchgear?What should I compare besides price when selecting an industrial product? Explore GIS switchgear ratings, IEC compliance, maintenance and lifecycle costs to make a confident procurement decision.By: Dr. Elena VoltOct 13, 2026
 Optical SensorsHow Do You Choose Optical Sensors for Harsh Industrial Environments?How do I choose components for harsh industrial environments? Discover how to select optical sensors for dust, heat, vibration, and washdown—and prevent costly missed detections.By: Dr. Hideo TanakaOct 13, 2026
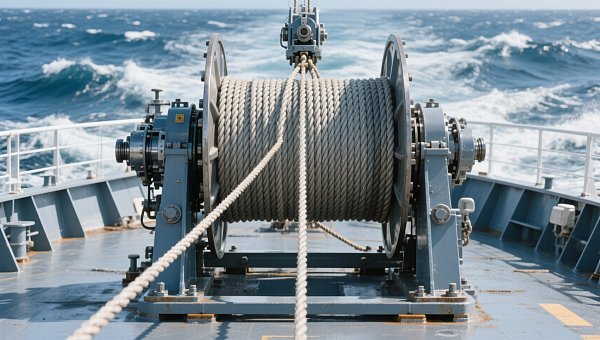
 Marine WinchesWhich Operating Conditions Can Change Marine Winch Selection?Which industrial application conditions can change product selection? Explore how loads, sea state, duty cycle and power shape marine winch selection to make a smarter investment.By: Captain Kenji SatoOct 13, 2026
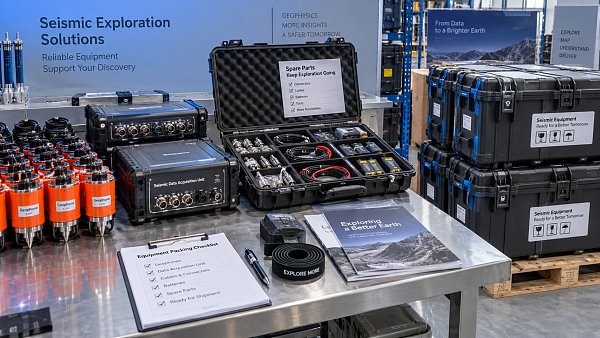
 Digital SeaChoosing a Seismic Survey Equipment Distributor: Lead Times and Spare PartsChoosing a seismic survey equipment distributor? Learn how to verify lead times, secure critical spare parts, and compare support to reduce downtime and buy with confidence.By: Captain Kenji SatoOct 13, 2026
 Digital SeaHow to Use Industrial Benchmarking Data to Evaluate Supplier Risk and CapabilityIndustrial benchmarking data for supplier evaluation helps buyers assess capability, compliance, capacity, and delivery risk. Learn how to make smarter, evidence-based sourcing decisions.By: Captain Kenji SatoOct 12, 2026
 Fabric LogicFashion Supply Chain Cost Trends: What Is Driving Margins in 2026?Fashion supply chain cost trends for 2026: discover how materials, freight, labor, compliance, and inventory are reshaping margins—and the strategies leaders need to protect profitability.By: Chloe DuboisOct 11, 2026
 Lumen VisionHow Smart Street Lighting Cuts Energy Use Without Compromising Road SafetySmart street lighting reduces energy use while protecting road safety through adaptive controls, reliable monitoring, and risk-based lighting design. Learn the key strategies.By: Dr. Hideo TanakaOct 10, 2026
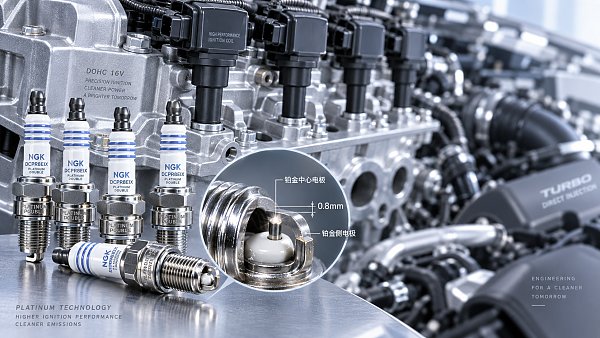
 Digital SeaDouble Platinum Spark Plugs: When Their Longer Service Life Justifies the CostDouble platinum spark plugs offer longer service life, stable gaps, and lower labor costs. Learn when their premium price is worth it for your vehicle.By: Captain Kenji SatoOct 08, 2026
 Sorting RobotsHow to Benchmark Linear Guide Load Ratings for High-Cycle Automation AxesLinear guide load rating benchmarks for high-cycle automation axes: compare loads, moments, stiffness, lubrication, and life calculations to select reliable guides.By: Marcus SterlingOct 07, 2026
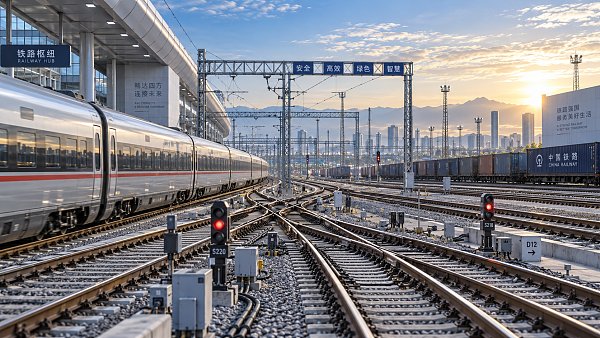
 Digital SeaWhich Rail Data Transparency Metrics Improve Capacity Planning and Service Reliability?Rail data transparency metrics reveal usable capacity, dwell, recovery, and asset risks—helping rail leaders plan more reliable, resilient services.By: Captain Kenji SatoOct 06, 2026
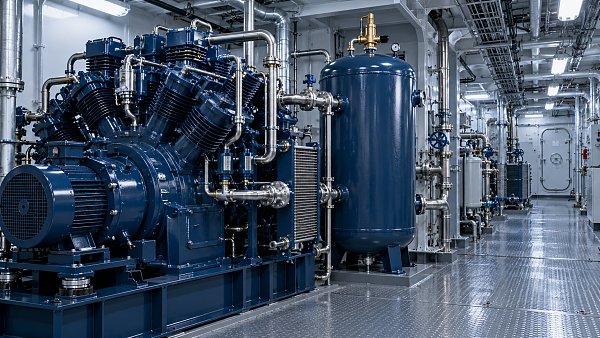
 Digital SeaHow to Select a Marine Piston Air Compressor for High-Demand Shipboard ServiceMarine piston air compressor selection guide for high-demand shipboard service—compare capacity, redundancy, air quality, maintenance, and compliance requirements.By: Captain Kenji SatoOct 05, 2026
 Grid ResilienceIEC 61850 Monitoring Latency: How to Set Performance Limits for Protection SystemsIEC 61850 monitoring latency explained: learn how to set, test, and verify end-to-end performance limits that protect critical GOOSE and Sampled Values systems.By: Dr. Elena VoltOct 04, 2026
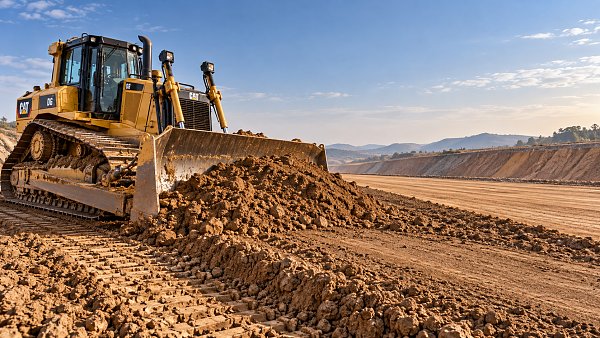
 Digital SeaHow to Select Bulldozers by Blade Type, Ground Conditions, and Earthmoving OutputBulldozers selection made practical: compare blade types, track setups, ground conditions, and cycle output to choose the right dozer for lower costs and reliable earthmoving.By: Captain Kenji SatoOct 03, 2026
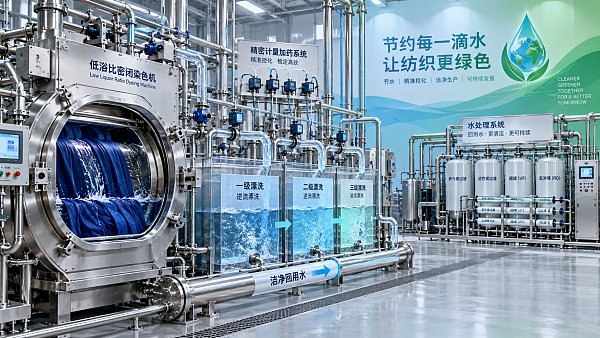
 Dyeing MachinesHow Sustainable Dyeing Cuts Water Use and Chemical Risk in Textile ProductionSustainable dyeing cuts water use and chemical risk through smarter liquor control, efficient rinsing, safer inputs, and repeatable textile quality.By: Chloe DuboisOct 02, 2026
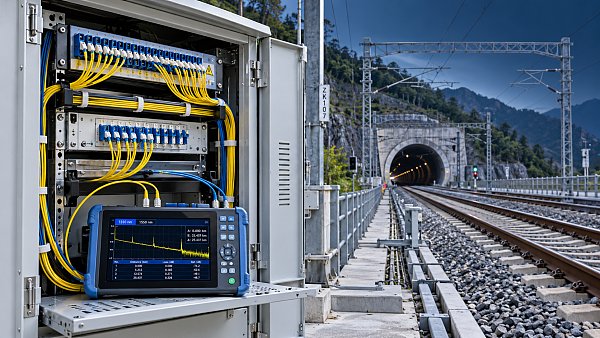
 Optical SensorsSingle-Mode Fiber Loss in Railway Networks: Causes, Budgets, and Test MethodsSingle mode railway fiber loss explained: identify causes, calculate realistic loss budgets, and apply OTDR and insertion-loss tests for reliable rail networks.By: Dr. Hideo TanakaOct 01, 2026
 Digital SeaIntegrated Transit Hub Planning: How to Balance Passenger Flow and Future CapacityIntegrated transit hub planning strategies for balancing passenger flow, resilient operations, phased delivery, and future capacity—explore practical insights for smarter hubs.By: Captain Kenji SatoSep 30, 2026
 Digital SeaWhat to Evaluate When Selecting a MaaS Ticketing Platform for Multimodal NetworksMaaS ticketing platform selection guide: evaluate interoperability, fare control, settlement, resilience, privacy, and scalability for multimodal networks.By: Captain Kenji SatoSep 29, 2026
 Digital SeaWhat Does Train Control Center Software Cost? Budgeting for Integration and SupportTrain control center software cost explained: compare integration, cybersecurity, commissioning, and long-term support to build a realistic rail operations budget.By: Captain Kenji SatoSep 28, 2026
 Digital SeaWhat to Evaluate in Thermite Rail Welding Equipment for Field Track RepairsThermite rail welding equipment: evaluate compatibility, preheating, alignment, safety, and supplier support for reliable field track repairs.By: Captain Kenji SatoSep 27, 2026
 Aseptic FillingISO 22000 Food Safety Certification: What Food Manufacturers Must PrepareISO 22000 food safety certification: discover the essential steps manufacturers need to build a robust FSMS, control hazards, and prepare confidently for audit success.By: Marcus SterlingSep 26, 2026
 UHV TransformersWhat Makes an Electrification Factory Ready for High-Voltage Equipment Production?Electrification factory readiness for high-voltage equipment: discover the essential standards, testing, traceability, safety, and workforce controls that drive reliable production.By: Dr. Elena VoltSep 25, 2026
 Digital SeaRail Signal Visibility: Sighting Distance, Contrast, and Verification RequirementsRail signal visibility: learn how sighting distance, contrast, weather, and verification controls help ensure safe, compliant signal recognition.By: Captain Kenji SatoSep 24, 2026
![]() GIS SwitchgearHow Do You Compare GIS Switchgear Suppliers When Certifications Differ?How do I compare industrial suppliers when certifications are not equivalent? Learn how to assess GIS switchgear test evidence, compliance scope, traceability, and project risk.By: Dr. Elena VoltSep 24, 2026
GIS SwitchgearHow Do You Compare GIS Switchgear Suppliers When Certifications Differ?How do I compare industrial suppliers when certifications are not equivalent? Learn how to assess GIS switchgear test evidence, compliance scope, traceability, and project risk.By: Dr. Elena VoltSep 24, 2026