BDI: 1,842 ▼ 1.2%
COTTON NO.2: 84.12 ▲ 0.4%
LME COPPER: 8,432.50 ▲ 2.1%
FOOD SAFETY INDEX: 94.2 ARCHIVE_SECURED
OPTICAL INDEX: 11,204.09 STABLE
BDI: 1,842 ▼ 1.2%

SECTOR INDEX
V.24.08 ARCHIVE
Hot Articles
- Kongsberg Maritime Unveils Arctic Hunter Unmanned Surface VesselKongsberg Maritime's Arctic Hunter unmanned surface vessel is proposed for the Royal Navy's Type 92 programme. Explore its technology and procurement implications.
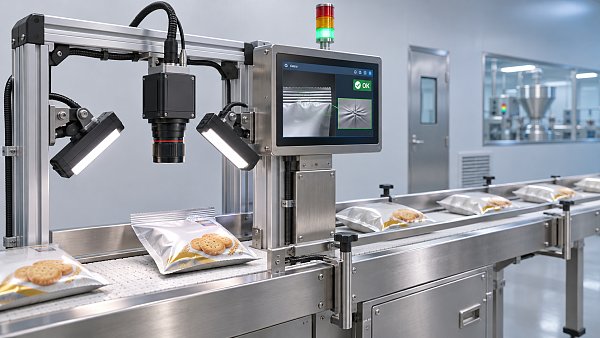
- How Accurate Is AI in Food Quality Control? Metrics and Testing MethodsExplore AI in food quality control accuracy, from recall and false negatives to validation methods. Learn how to assess real-world inspection reliability.
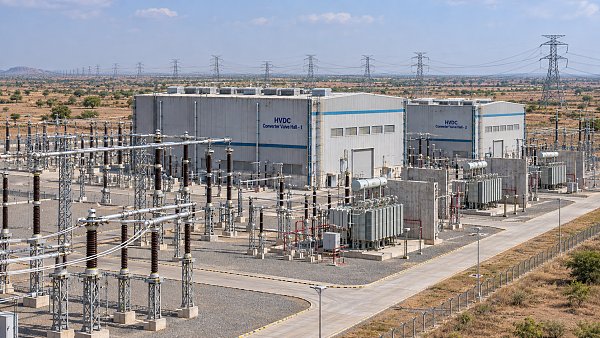
- GE Vernova Selected for 6 GW HVDC Link in IndiaGE Vernova will design a 6 GW HVDC link for PGCIL, connecting Rajasthan and South Kalamb to support India's clean energy transition. Discover the project.
How to read a noise barrier sound reduction index correctly


For procurement teams evaluating acoustic infrastructure, understanding the noise barrier sound reduction index is essential for comparing products beyond marketing claims. A correct reading helps you assess real-world performance, compliance alignment, and long-term project value. This guide explains how to interpret the index accurately so you can make more confident, data-driven sourcing decisions.
Why the noise barrier sound reduction index needs a checklist-based reading

A noise barrier sound reduction index looks simple, but one number rarely tells the full acoustic story. Performance depends on test method, installation conditions, frequency range, and project geometry.
In cross-sector infrastructure work, the index is often reviewed beside fire behavior, wind load, corrosion resistance, lifecycle cost, and regulatory fit. Reading it correctly prevents overbuying or underperforming systems.
This matters across highways, rail corridors, utilities, ports, industrial plants, and mixed-use developments. A checklist approach keeps acoustic selection tied to verified data instead of brochure language.
Core checklist: how to read a noise barrier sound reduction index correctly
Use the following checks before comparing any quoted noise barrier sound reduction index across suppliers, product families, or tender documents.
- Confirm the referenced standard. Check whether the value comes from ISO, EN, ASTM, or a local method, because different test frameworks can produce non-equivalent ratings.
- Identify whether the figure represents sound insulation, insertion loss, or absorption. These terms are related, but they measure different behaviors and should never be compared directly.
- Review the frequency basis. A single weighted rating may hide weak performance at low frequencies, which are often critical near heavy traffic, transformers, compressors, or marine equipment.
- Check the laboratory or field condition. Lab-tested panels often perform better than installed barriers if joints, posts, foundations, and edge conditions are not controlled properly.
- Verify specimen construction. Panel thickness, internal fill, surface density, perforation pattern, and frame design all affect the stated noise barrier sound reduction index.
- Read the mounting assumptions. Acoustic performance can change when the barrier is reflective, absorptive, cantilevered, transparent, or combined with a retaining or safety structure.
- Examine joints and leakage paths. Small gaps at posts, panel connections, service penetrations, or under-barrier ground interfaces can reduce real acoustic effectiveness significantly.
- Compare height and line-of-sight geometry. The index alone does not predict shielding effect unless the final barrier blocks the sound path between source and receiver.
- Ask for octave-band or one-third-octave data. Detailed frequency data supports engineering review and helps match the barrier to the dominant project noise spectrum.
- Check weathering durability. Moisture ingress, UV exposure, corrosion, and delamination can alter the barrier’s long-term acoustic behavior and reduce the value behind the declared index.
- Validate compliance documentation. A credible noise barrier sound reduction index should be supported by test reports, traceable samples, and consistent product identification.
- Assess total system performance. Posts, seals, caps, transparent inserts, and access doors may become the weakest acoustic elements even when the main panel rating looks strong.
Understand the key terms before comparing values
Sound reduction index vs insertion loss
The noise barrier sound reduction index usually describes how much sound transmission a barrier element resists. It is mainly a material or panel property under defined test conditions.
Insertion loss describes the actual noise decrease after a barrier is installed between source and receiver. It depends on site geometry, barrier height, distance, terrain, reflections, and diffraction.
Insulation vs absorption
A high noise barrier sound reduction index does not automatically mean strong sound absorption. Reflective barriers may block transmission well while still sending energy back toward another receiver.
In constrained corridors, yards, or industrial compounds, absorption can matter almost as much as insulation. Dual-sided acoustic behavior should be reviewed where reflected sound is a risk.
How the index changes by application scenario
Road and highway barriers
Traffic noise contains tire, engine, and aerodynamic components across a broad frequency range. Here, the noise barrier sound reduction index must be checked with height, roadside distance, and maintenance access constraints.
A moderate panel index may still deliver strong project outcomes if the barrier geometry is efficient. A high panel index may disappoint if gaps, slope conditions, or short barrier length remain unresolved.
Rail and transit corridors
Rail applications often involve wheel-rail interaction, braking, vibration-related components, and strict safety envelopes. The noise barrier sound reduction index should be reviewed with aerodynamic loads and debris exposure.
Transparent sections may be necessary for visibility. In those cases, compare the acoustic rating of clear panels, framing systems, and connection details rather than relying on opaque panel data.
Industrial plants and utility assets
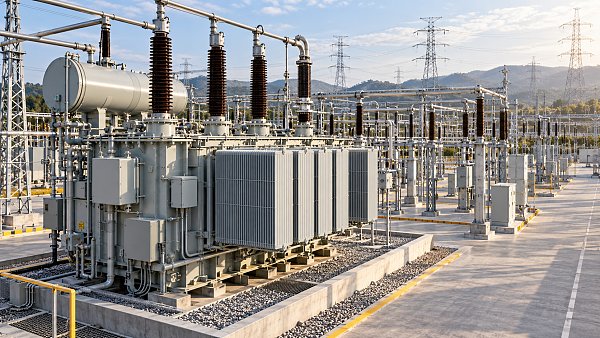
Around substations, process plants, ports, or equipment compounds, low-frequency noise can dominate. A quoted noise barrier sound reduction index must be checked against band-specific data, not only a weighted single number.
Equipment access doors, cable penetrations, ventilation needs, and corrosion environment often determine the final result. System integration matters more than the panel declaration alone.
Commonly overlooked items that distort the reading
Ignoring test specimen details
Two products may show a similar noise barrier sound reduction index while using different core densities, skins, or edge details. Without specimen details, the comparison can be misleading.
Treating a weighted rating as universal
A single-number rating simplifies communication, but real projects respond to actual frequency content. Heavy vehicles, fans, pumps, and transformers do not stress barriers in the same way.
Overlooking installation leakage
Even a strong noise barrier sound reduction index loses value when there are gaps beneath panels, poor seals around posts, or unsealed service openings. Leakage often defeats expensive acoustic upgrades.
Missing lifecycle degradation
Acoustic fill settlement, water absorption, corrosion, vandalism, and UV damage can reduce performance over time. The initial index should be paired with durability evidence and maintenance planning.
Practical steps for evaluating supplier data
- Request the full test report, not only a brochure table, and verify that the tested assembly matches the quoted commercial configuration.
- Map the project noise source by frequency and operating condition before selecting a target noise barrier sound reduction index.
- Review barrier drawings for joints, terminations, access points, and transparent sections that may alter installed acoustic behavior.
- Cross-check acoustic data with structural, fire, environmental, and corrosion requirements so one compliance goal does not undermine another.
- Use field modeling or acoustic simulation when the corridor geometry is complex or when reflective surfaces may influence the final outcome.
Conclusion and next action
Reading a noise barrier sound reduction index correctly means looking beyond the headline number. Standard, frequency content, test setup, leakage control, and installation geometry all shape actual performance.
For multi-sector infrastructure decisions, the most reliable approach is to compare complete system evidence against the project’s real noise profile and compliance framework. That creates stronger technical alignment and better long-term value.
As a next step, build a comparison sheet that records the noise barrier sound reduction index, test standard, octave-band data, assembly details, and durability notes for each candidate solution. That single document will sharpen evaluation quality immediately.
Recommended for You
 Digital SeaKongsberg Maritime Unveils Arctic Hunter Unmanned Surface VesselKongsberg Maritime's Arctic Hunter unmanned surface vessel is proposed for the Royal Navy's Type 92 programme. Explore its technology and procurement implications.By: Captain Kenji SatoNov 10, 2026
 Sorting RobotsHow Accurate Is AI in Food Quality Control? Metrics and Testing MethodsExplore AI in food quality control accuracy, from recall and false negatives to validation methods. Learn how to assess real-world inspection reliability.By: Marcus SterlingNov 10, 2026
 UHV TransformersGE Vernova Selected for 6 GW HVDC Link in IndiaGE Vernova will design a 6 GW HVDC link for PGCIL, connecting Rajasthan and South Kalamb to support India's clean energy transition. Discover the project.By: Dr. Elena VoltNov 09, 2026
 Grid ResilienceEurope's Grid Compliance Standards in 2026: Generator Connection RequirementsExplore new grid compliance standards 2026 Europe projects must address, from generator connection rules to testing and documentation. Prepare for approval.By: Dr. Elena VoltNov 09, 2026
 Technical FabricsNonwoven Bonding Cost Data: Comparing Thermal and Chemical ProcessesExplore nonwoven bonding cost data to compare thermal and chemical processes, assess usable yield, and choose the best-value option for your application.By: Chloe DuboisNov 08, 2026
 Fiber LasersIndustrial Lasers to 2035: Automotive Lightweighting and Precision Welding Drive DemandExplore the industrial laser market outlook to 2035 and discover how automotive lightweighting and precision welding could shape demand and procurement.By: Dr. Hideo TanakaNov 07, 2026
 Technical FabricsChoosing Geotextile Under Railway Ballast: Key Performance RequirementsChoosing geotextile under railway ballast? Explore essential filtration, drainage, strength and durability criteria to make a confident, project-specific selection.By: Chloe DuboisNov 07, 2026
 Digital SeaChoosing Rail Welding Equipment for Maintenance: Field Conditions and Weld TypesChoose rail welding equipment for maintenance with confidence. Compare welding methods, field constraints, inspection needs, and lifecycle costs.By: Captain Kenji SatoNov 06, 2026
 Digital SeaIndia Broadband Forum Urges Stronger Submarine Cable ResilienceIndia’s submarine cable resilience is in focus as the Broadband India Forum urges faster repairs, more vessels and stronger landing infrastructure.By: Captain Kenji SatoNov 06, 2026
 Digital SeaChoosing a Railway Network Switch Supplier: Reliability and Support CriteriaChoosing a railway network switch supplier? Compare reliability, standards evidence, cybersecurity, and lifecycle support to reduce project risk.By: Captain Kenji SatoNov 05, 2026
 Grid ResilienceUS Grid Equipment Import Ban Raises Cost and Implementation ConcernsThe US grid equipment import ban raises concerns over costs and delivery delays. Explore how unclear criteria could affect procurement and supply chains.By: Dr. Elena VoltNov 05, 2026
 Digital SeaRailway Coupler Price: How Type and Specifications Affect QuotesRailway coupler price depends on type, specifications, and order scope. Learn how to compare quotes, avoid hidden costs, and make a confident buying decision.By: Captain Kenji SatoNov 04, 2026
 Grid ResilienceGlobal Smart Grid Companies Raise $3 Billion in First Nine Months of 2026Global smart grid companies raised $3 billion in the first nine months of 2026. Explore the funding breakdown and potential implications for buyers and suppliers.By: Dr. Elena VoltNov 04, 2026
 Digital SeaChoosing Wholesale Pet Toys: How to Evaluate Suppliers and Minimum OrdersWholesale pet toys: learn how to assess suppliers, compare minimum orders and landed costs, and reduce inventory risk before you buy.By: Captain Kenji SatoNov 03, 2026
 Digital SeaSustainable Packaging Design: How to Choose Materials and Reduce WasteDiscover how sustainable packaging design helps reduce waste, protect products, and control costs with practical material choices and proven testing strategies.By: Captain Kenji SatoNov 02, 2026
 Technical FabricsUSMCA's First Joint Review Puts Textile Supply Chain Rules in FocusUSMCA's first joint review puts textile supply chain rules in focus. Explore potential impacts on origin compliance, sourcing and tariff treatment.By: Chloe DuboisNov 02, 2026
 Digital SeaManufacturing KPI Benchmarking: How to Compare Production PerformanceBenchmarking KPI manufacturing performance? Learn how to compare OEE, quality and downtime, identify meaningful gaps, and turn insights into practical improvements.By: Captain Kenji SatoNov 01, 2026
 Smart MetersCCI Approves Adani Energy Solutions' ₹305 Billion Acquisition of IntelliSmartCCI approves Adani Energy Solutions' ₹305 billion acquisition of IntelliSmart. Discover what the deal could mean for India's smart meter market.By: Dr. Elena VoltNov 01, 2026
 Digital SeaChoosing a Coin Laundry Machinery OEM: What Buyers Should EvaluateChoosing a coin laundry machinery OEM? Compare machine specifications, payment integration, lifecycle costs, and support to make a confident buying decision.By: Captain Kenji SatoOct 31, 2026
 Grid ResilienceUS Energy Department Announces $237 Million Grid SCALED Funding ProgramExplore the DOE's $237 million Grid SCALED funding program and its goals to strengthen grid equipment supply chains, lower electricity costs, and improve resilience.By: Dr. Elena VoltOct 31, 2026
 UHV TransformersA Decade of UHV Power in Shandong: Province Leads in Station NumbersShandong UHV power leads China in station numbers. Explore a decade of grid development and its implications for electricity supply and business planning.By: Dr. Elena VoltOct 30, 2026
 Digital SeaChoosing a Composite Train Body Panel Manufacturer: Fire Safety and Quality ChecksChoosing a composite train body panels manufacturer? Learn how to verify fire test evidence, audit production quality, and avoid costly approval gaps before you buy.By: Captain Kenji SatoOct 29, 2026
 Subsea ROV/AUVOcean Infinity Deploys Six AUVs Together Beyond 5,000 MetresOcean Infinity reportedly deployed six HUGIN AUVs beyond 5,200 metres. Explore what concurrent deepwater missions could mean for seabed surveys and procurement.By: Captain Kenji SatoOct 29, 2026
 Grid ResilienceRenewable Energy Grid Balancing: How Storage and Demand Response Work TogetherExplore renewable energy grid balancing with storage and demand response. Learn how coordinated controls manage shortfalls, absorb surplus power, and improve grid reliability.By: Dr. Elena VoltOct 28, 2026
 Subsea ROV/AUVSeaber Introduces 13 kg RAVEN AUV to Target Mine Countermeasure CostsSeaber’s 13 kg RAVEN AUV targets lower mine countermeasure costs with two mission configurations. Explore its potential value for naval operations and procurement.By: Captain Kenji SatoOct 28, 2026
 Digital SeaBallast Water Management Rules: IMO vs. USCG Compliance RequirementsBallast water management rules explained: compare IMO and USCG approvals, operating limits, and records. Get practical checks to reduce compliance risks and costly port delays.By: Captain Kenji SatoOct 27, 2026
 Subsea ROV/AUVEni Signs Main Cronos Contracts, Moving Gas Project into ExecutionEni’s Cronos gas project enters execution as major contracts are signed. Explore the Cyprus development, Egypt processing plans and key milestones toward first gas in 2028.By: Captain Kenji SatoOct 27, 2026
 Digital SeaBenefits of Refurbished Semiconductor Equipment: When Do Savings Justify the Risk?Explore the benefits of refurbished semiconductor equipment. Learn how to weigh savings against process risks, qualification costs, and support gaps before investing.By: Captain Kenji SatoOct 26, 2026
 Digital SeaSemiconductor Equipment Overhaul: Diagnosing Persistent Process DriftSemiconductor equipment overhaul leaving process drift unresolved? Discover how to pinpoint vacuum, sensor, thermal, and conditioning issues to restore stability and reduce repeat service calls.By: Captain Kenji SatoOct 26, 2026
 Digital SeaSemiconductor Equipment Refurbishment Process: Cleaning to QualificationExplore the semiconductor equipment refurbishment process, from precision cleaning to qualification. Learn how measurable testing helps verify production readiness and reduce risk.By: Captain Kenji SatoOct 26, 2026
 Digital SeaBidding for Offshore Decommissioning Projects: Scope and Liability ChecksBidding for offshore decommissioning projects? Discover key scope, liability, and insurance checks to avoid hidden costs, protect margins, and bid with confidence.By: Captain Kenji SatoOct 26, 2026